Processing customers, start here
Reduce rust and attack by media
Data include a record of 1000 h neutral salt spray for a specific process.
1000 h is limited to a specific process and thickness; substrate, test standard, thickness, heat treatment and pass criteria must be confirmed in writing. The 100 h in the technical details is a historical comparison test, not a capability limit, and cannot be converted into service life.
Tell our engineers your requirements
Enter substrate, quantity and performance targets; if you don't know the specific metrics, you can describe the problem you face.
Detailed test data · expand test conditions, historical data and interpretation
Conclusions first
The 100 h table is a historical comparison of specific specimens and cannot be converted into actual service life.
Coating thickness and heat-treatment condition must be compared together with the rating.
Ratings retain the source records and are only for comparing specimens in this group, not as contract acceptance grades.
Chemical resistance marks are only screening clues; compatibility must be verified by concentration and temperature.
Test conditions
Neutral salt spray test
- Medium
- 5% NaCl solution
- Thickness
- 10 μm、30 μm
- Heat treatment
- Not heat-treated, 200°C, 300°C heat treatment
- Substrate
- SPCC
Observation times: 3, 24, 48, 100 h. The standard must be confirmed by the test report; ASTM B117, ISO 9227 or GB/T 10125 cannot be directly assumed to be the standard used for this table.
Historical chemical resistance comparison
- Medium
- See media and pH notes in the table below
A media screening reference from electroless nickel data; actual use requires compatibility verification by concentration, temperature and contact time.
Salt spray data vs. thickness
The same coating is listed side by side at 10 μm and 30 μm; then compare at the same observation time and heat-treatment condition. Only records from the original table are shown; untested thicknesses and hours are not extrapolated.
On mobile, swipe the chart left/right; tap a chart to open the large image.
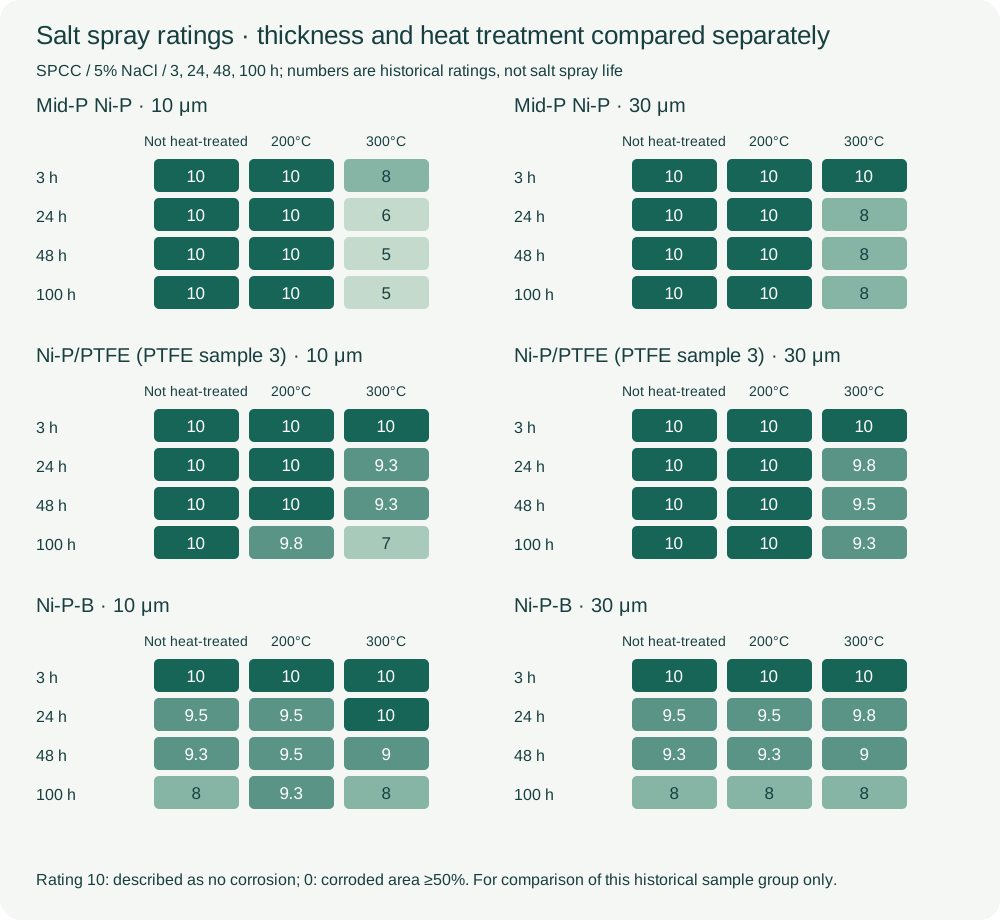
Ni-P-B at 30 μm is not better than 10 μm under all conditions; this set of historical results cannot be simplified into a single thickness–life curve.
Other salt spray records: each tied to its own specimen conditions
| Data group | Thickness | Hours & result type | Condition status |
|---|---|---|---|
| High-P case on aluminum parts | 25–28 μm | Appearance record after 54 h | Phosphorus 10–12 wt%; only an appearance record for this case, not a salt spray pass duration |
View the aluminum part case and photo notes ↗
Data basis: six rating tables from the source corrosion resistance data; complete test conditions and item-by-item values are below.
Data & interpretation
Neutral salt spray test | Mid-P Ni-P | coating thickness 10 μm
The table scrolls horizontally; the first column keeps the comparison items.
| Test time | Not heat-treated | 200°C heat treatment | 300°C heat treatment |
|---|---|---|---|
| 3 h | 10 | 10 | 8 |
| 24 h | 10 | 10 | 6 |
| 48 h | 10 | 10 | 5 |
| 100 h | 10 | 10 | 5 |
How to read: first confirm this group's coating and thickness (10 μm), then find the row by test time, and finally the column by heat-treatment condition; the intersection is the corrosion rating. Numbers are historical corrosion ratings; higher means lighter corrosion in that record. The data describe 10 as no corrosion and 0 as corroded area reaching or exceeding 50%. Only for comparing this group's historical specimens; not directly usable as contract acceptance grades.
Neutral salt spray test | Mid-P Ni-P | coating thickness 30 μm
The table scrolls horizontally; the first column keeps the comparison items.
| Test time | Not heat-treated | 200°C heat treatment | 300°C heat treatment |
|---|---|---|---|
| 3 h | 10 | 10 | 10 |
| 24 h | 10 | 10 | 8 |
| 48 h | 10 | 10 | 8 |
| 100 h | 10 | 10 | 8 |
How to read: first confirm this group's coating and thickness (30 μm), then find the row by test time, and finally the column by heat-treatment condition; the intersection is the corrosion rating. Numbers are historical corrosion ratings; higher means lighter corrosion in that record. The data describe 10 as no corrosion and 0 as corroded area reaching or exceeding 50%. Only for comparing this group's historical specimens; not directly usable as contract acceptance grades.
Neutral salt spray test | Ni-P/PTFE (PTFE specimen 3) | coating thickness 10 μm
The table scrolls horizontally; the first column keeps the comparison items.
| Test time | Not heat-treated | 200°C heat treatment | 300°C heat treatment |
|---|---|---|---|
| 3 h | 10 | 10 | 10 |
| 24 h | 10 | 10 | 9.3 |
| 48 h | 10 | 10 | 9.3 |
| 100 h | 10 | 9.8 | 7 |
How to read: first confirm this group's coating and thickness (10 μm), then find the row by test time, and finally the column by heat-treatment condition; the intersection is the corrosion rating. Numbers are historical corrosion ratings; higher means lighter corrosion in that record. The data describe 10 as no corrosion and 0 as corroded area reaching or exceeding 50%. Only for comparing this group's historical specimens; not directly usable as contract acceptance grades.
Neutral salt spray test | Ni-P/PTFE (PTFE specimen 3) | coating thickness 30 μm
The table scrolls horizontally; the first column keeps the comparison items.
| Test time | Not heat-treated | 200°C heat treatment | 300°C heat treatment |
|---|---|---|---|
| 3 h | 10 | 10 | 10 |
| 24 h | 10 | 10 | 9.8 |
| 48 h | 10 | 10 | 9.5 |
| 100 h | 10 | 10 | 9.3 |
How to read: first confirm this group's coating and thickness (30 μm), then find the row by test time, and finally the column by heat-treatment condition; the intersection is the corrosion rating. Numbers are historical corrosion ratings; higher means lighter corrosion in that record. The data describe 10 as no corrosion and 0 as corroded area reaching or exceeding 50%. Only for comparing this group's historical specimens; not directly usable as contract acceptance grades.
Neutral salt spray test | Ni-P-B | coating thickness 10 μm
The table scrolls horizontally; the first column keeps the comparison items.
| Test time | Not heat-treated | 200°C heat treatment | 300°C heat treatment |
|---|---|---|---|
| 3 h | 10 | 10 | 10 |
| 24 h | 9.5 | 9.5 | 10 |
| 48 h | 9.3 | 9.5 | 9 |
| 100 h | 8 | 9.3 | 8 |
How to read: first confirm this group's coating and thickness (10 μm), then find the row by test time, and finally the column by heat-treatment condition; the intersection is the corrosion rating. Numbers are historical corrosion ratings; higher means lighter corrosion in that record. The data describe 10 as no corrosion and 0 as corroded area reaching or exceeding 50%. Only for comparing this group's historical specimens; not directly usable as contract acceptance grades.
Neutral salt spray test | Ni-P-B | coating thickness 30 μm
The table scrolls horizontally; the first column keeps the comparison items.
| Test time | Not heat-treated | 200°C heat treatment | 300°C heat treatment |
|---|---|---|---|
| 3 h | 10 | 10 | 10 |
| 24 h | 9.5 | 9.5 | 9.8 |
| 48 h | 9.3 | 9.3 | 9 |
| 100 h | 8 | 8 | 8 |
How to read: first confirm this group's coating and thickness (30 μm), then find the row by test time, and finally the column by heat-treatment condition; the intersection is the corrosion rating. Numbers are historical corrosion ratings; higher means lighter corrosion in that record. The data describe 10 as no corrosion and 0 as corroded area reaching or exceeding 50%. Only for comparing this group's historical specimens; not directly usable as contract acceptance grades.
Chemical resistance | transcription of legible entries
The table scrolls horizontally; the first column keeps the comparison items.
| Media (entries with the same mark merged) | Historical mark |
|---|---|
| Hydrochloric acid (pH ≤ 4) | × |
| Hydrochloric acid (pH ≥ 5) | △ |
| Chlorine gas (dry) | ○ |
| Chlorine gas (wet) | △ |
| Hydrogen chloride gas (dry/wet) | △ |
| Chloroform (anhydrous) | ○ |
| Dichlorobenzene (anhydrous) | ○ |
| Carbon tetrachloride (anhydrous) | ○ |
| Aluminum chloride | ○ |
| Ferric chloride, cupric chloride | △ |
| Nitric acid | × |
| Sulfur, sulfur dioxide gas | × |
| Carbon disulfide | ○ |
| Sodium sulfate | △ |
| Ferric sulfate | × |
| Acetic acid, monochloroacetic acid, butyric acid, lactic acid, propionic acid, citric acid | △ |
| Beer | △ |
| Soy sauce, amino acids | ○ |
| Higher fatty acids (e.g. stearic acid), butter | ○ |
| Sodium hydroxide, potassium hydroxide, lithium hydroxide, barium hydroxide | ○ |
| Sodium peroxide, sodium carbonate, sodium phosphate, sodium metasilicate | ○ |
| Boric acid | ○ |
| Sodium cyanide, potassium cyanide, barium cyanide | ○ |
| Soap, alkaline cleaners, black liquor | ○ |
| Ammonia water | × |
| Crude oil, gasoline, benzene, tar, dichloroethylene, biphenyl | ○ |
| Ethanol, methanol, butanol, glycerin | ○ |
| Fatty acids, fats, sorbitol solution | ○ |
| Acetone, naphtha (odorless) | ○ |
| Glucose, starch sugar, gelatin, molasses | ○ |
| Dibutyl phthalate, sodium thiosulfate | ○ |
○, △ and × are qualitative marks from the source and serve only as media screening clues; even ○ does not mean usable at any concentration and temperature. Actual selection should be based on material compatibility tests on the corresponding workpiece.
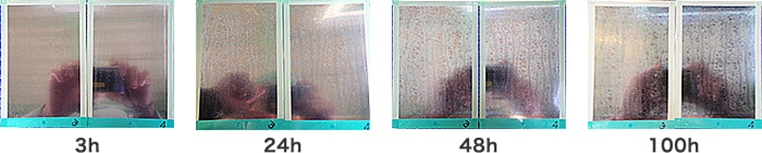
Left to right: 3, 24, 48, 100 h; the source notes 200°C heat treatment. Photos only show specimen appearance; thickness grouping and ratings follow the text table.
View full-size image ↗
Left to right: 3, 24, 48, 100 h; data note 10 μm, 200°C heat treatment. Photo appearance cannot replace standard ratings.
View full-size image ↗
Left to right: 3, 24, 48, 100 h; data note 10 μm, 200°C heat treatment. Photos only show specimen appearance; corrosion grades are not inferred from color or lighting.
View full-size image ↗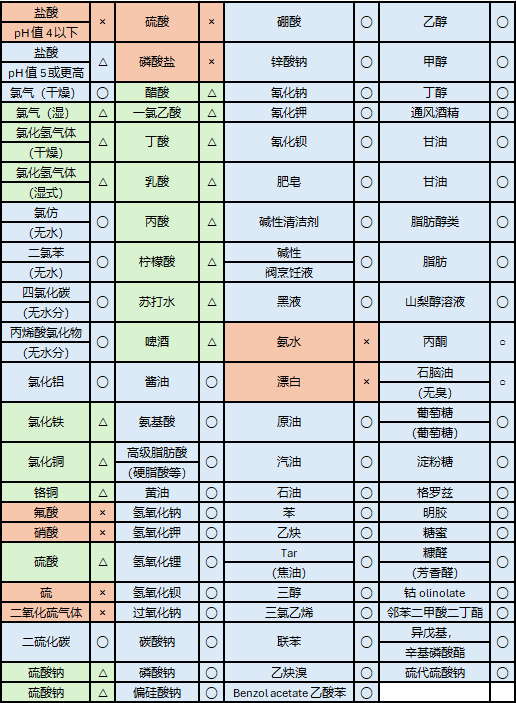
○, △ and × are qualitative marks from historical data; legible entries are in the text table. The chart is for source checking and is not a compatibility conclusion for actual workpieces.
View full-size image ↗Test charts & test conditions
View charts, methods and conditions test by test. Vector charts can be clicked to enlarge; each data group applies only to the corresponding specimens and test conditions.
Coating thickness & grade reference
Test method & conditions
- Source standard as cited
- JIS (as noted in source)
- Applicable substrates
- Iron & iron alloys, copper & copper alloys, aluminum & aluminum alloys
- Minimum thickness
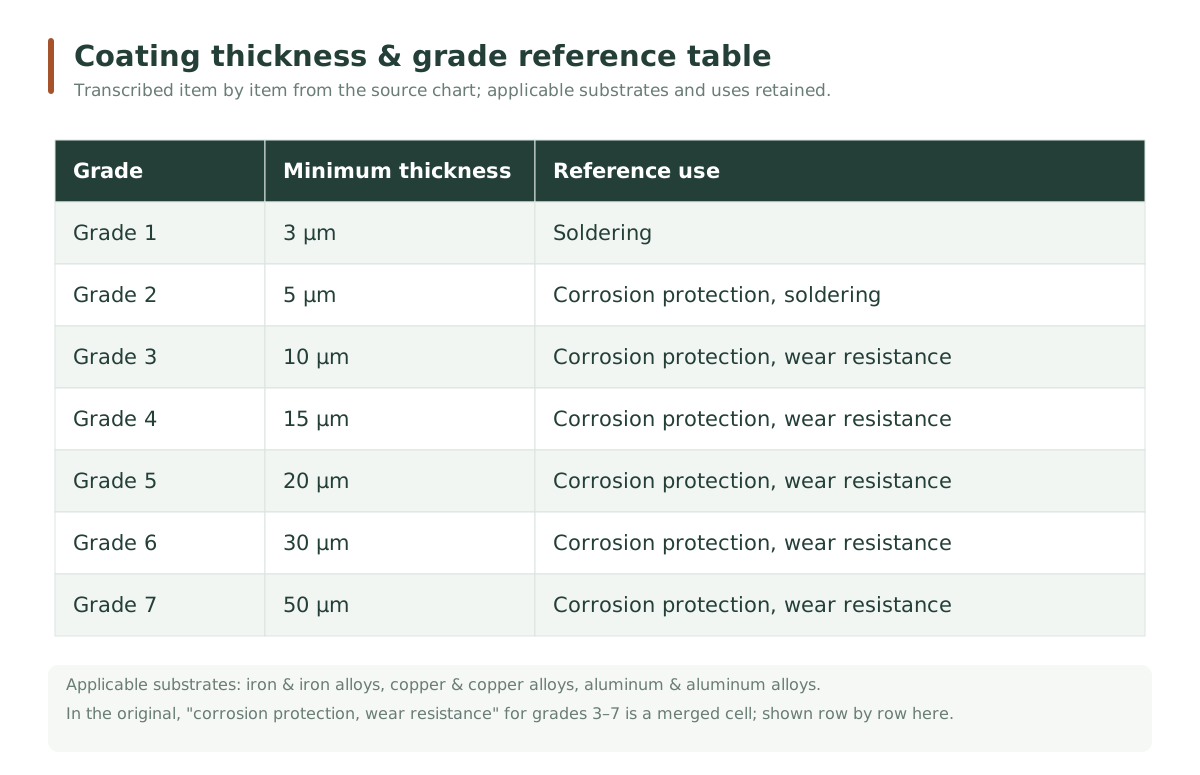
- Grades 1–7: 3 / 5 / 10 / 15 / 20 / 30 / 50 μm
- Use
- Solderable, corrosion-resistant, wear-resistant; graded per the original table
This table is the thickness grade reference cited by the source; the standard and edition adopted must be confirmed per order.
Source
Selection advice & data boundaries
Difference between 100 h and 1000 h: this page shows historical comparison tables up to 100 h; the "1000-hour salt spray" in Ni-P product data is a claim under specific process and thickness conditions. Specific thickness, sealing, substrate, standard and pass criteria require written confirmation by engineers; it cannot be used to promise that any workpiece reaches 1000 h.
The chemical resistance text table is for media screening and does not replace a complete material compatibility report; actual media, concentration, temperature and contact time should be verified item by item.
Coating density and barrier effect: the risk of corrosive media reaching the substrate should be evaluated together with porosity, coverage integrity and coating thickness; it cannot be judged from appearance or a single salt spray rating alone.
Photos are for observing the appearance of historical specimens; lighting differences or color changes are not inferred as standard corrosion grades.